Space Weather Today
Live solar and geomagnetic conditions, explained with evidence-first context.
Key Metrics
Daily Briefing
Charts
Kp Index — Last 72 Hours
Solar Wind — Last 24 Hours
GOES X-ray Flux — Last 24 Hours
F10.7 & Sunspot — Last 90 Days
Aurora Ovation Map
Live aurora forecast from NOAA SWPC (OVATION model). Bright green = higher probability of visible aurora. Heavier geomagnetic activity (higher Kp) pushes the oval to lower latitudes.
Northern Hemisphere
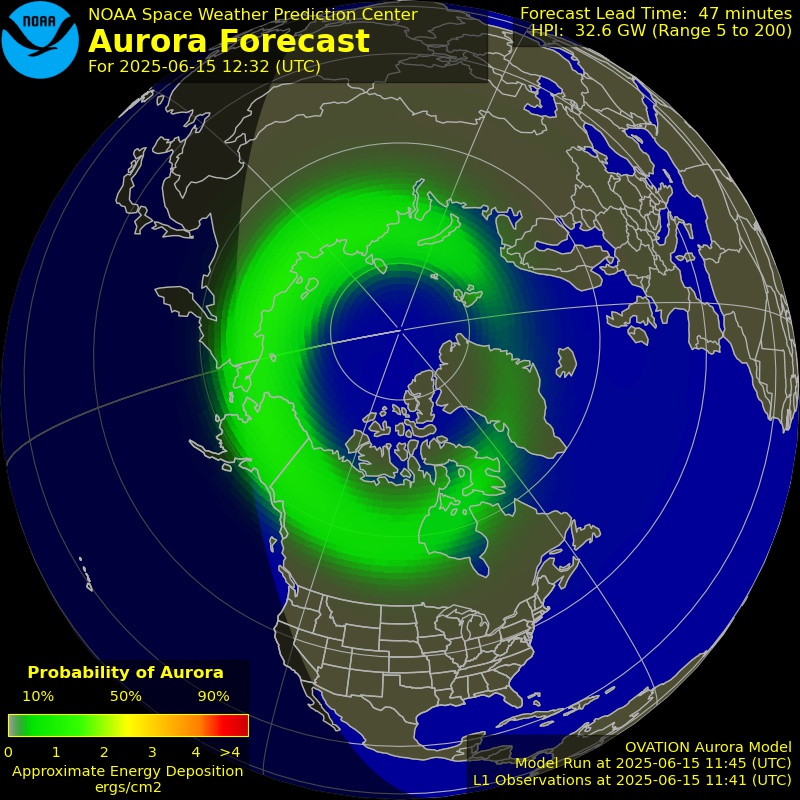
NOAA SWPC OVATION · 30-min aurora forecast
Southern Hemisphere
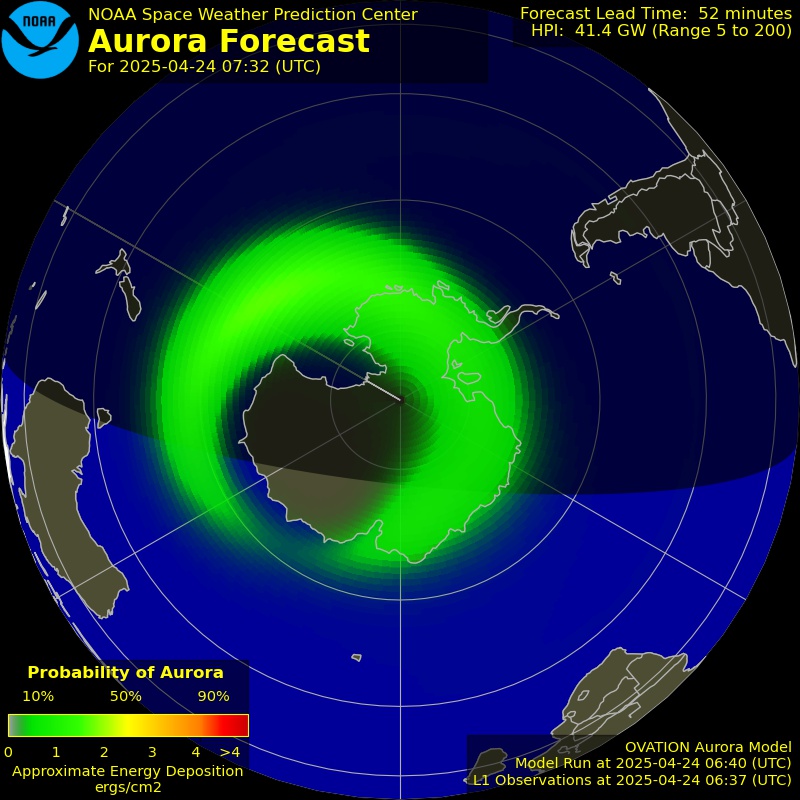
NOAA SWPC OVATION · 30-min aurora forecast
Data & images © NOAA SWPC. Updated continuously. Map refreshes on page load.
Aurora Forecast Outlook
Estimated Kp over time (NOAA SWPC). Higher Kp = better aurora chances at lower latitudes. Official 3-day Kp forecast sources.
Weekly narrative forecast from NOAA SWPC (WWV). Operational forecast shown for context — not a health indicator.
Recent Events
How to Read This Dashboard
⚡ These are measurements
All values are direct or near-real-time measurements of solar and near-Earth space conditions from NOAA SWPC and NASA DONKI instruments.
🛰 Established relevance is technical
Space weather primarily affects technological systems: satellite operations, GNSS/GPS accuracy, HF radio communication, power grids, spacecraft electronics, and aviation radiation at high altitudes/polar routes. Aurora visibility increases with geomagnetic activity.
🧬 Health evidence is limited
Current scientific evidence does not support using these metrics for personal health, mood, productivity, or behavior predictions. GrivavaLAB has published null-result analyses and robustness tests confirming no credible population-level associations with several health indicators.
📐 Status rules are documented
Overall status (Quiet/Unsettled/Active/Storm) follows deterministic Kp thresholds documented in our methodology. No proprietary or black-box scoring is used.
Historical Archive
Daily summaries, major events, and downloadable data snapshots are available in the archive section.